VCG overview
This section describes the Voxel Cloud Generator (VCG) application. It is used to create printfiles and manages their placement on the printable area in the cell.
The GUI
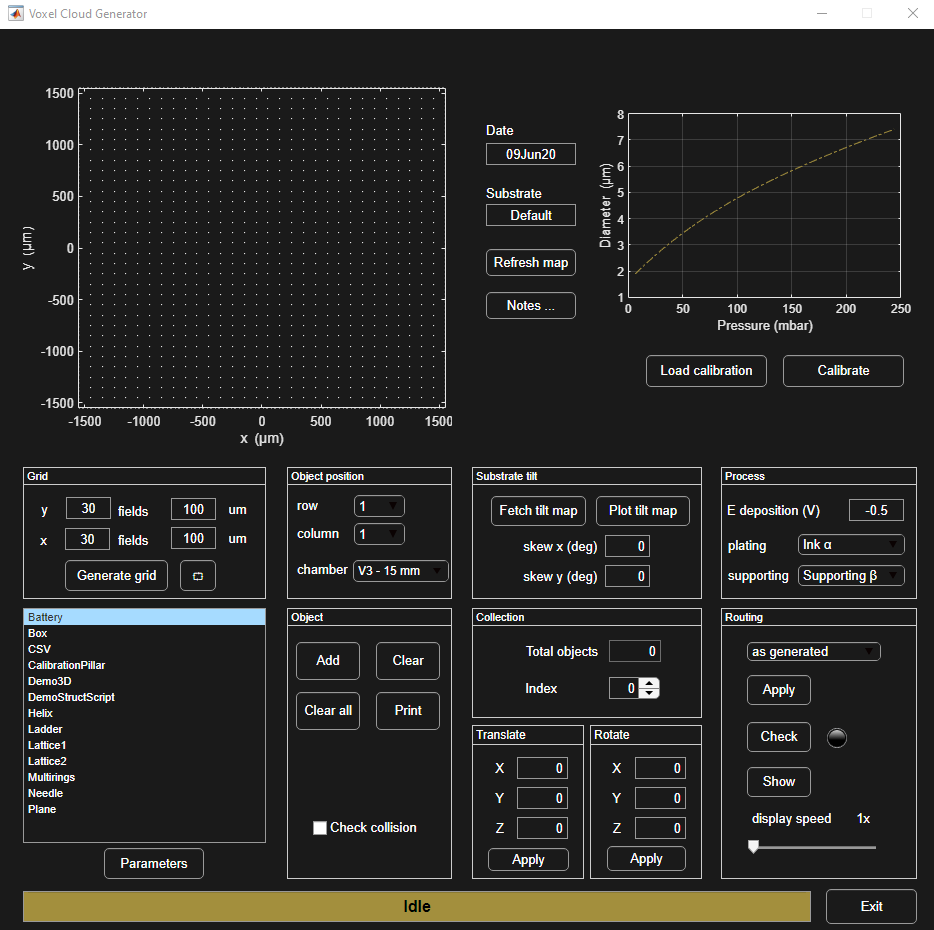
Substrate overview
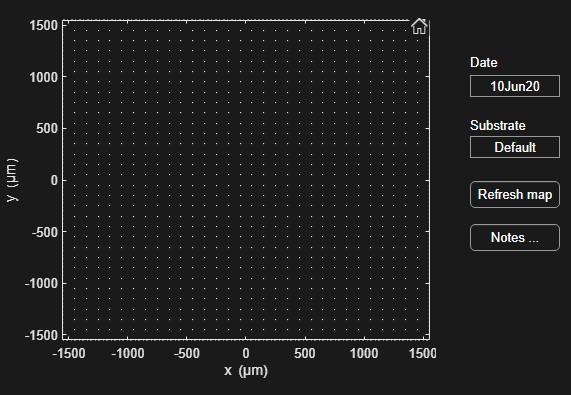
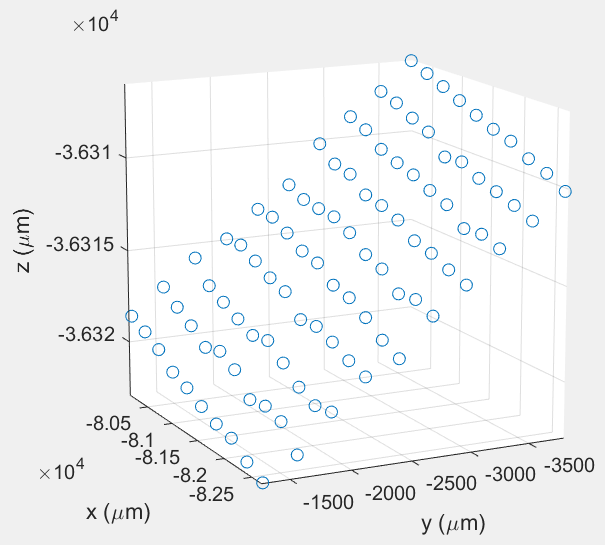
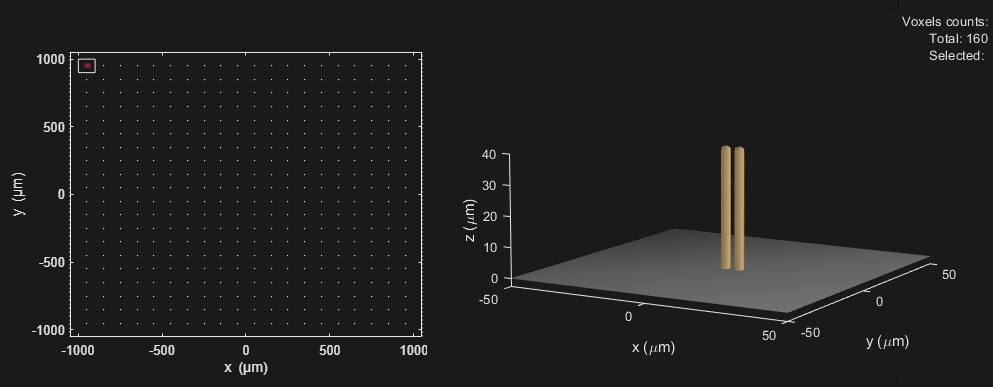
Each object is printed on a substrate and the top left figure depicts the active substrate. To create a new substrate or to access objects printed on an old one, type the right Substrate name and click Refresh map. Any printfile generated with the VCG for this substrate name will be previewed on the figure.
The grid of grey points shows the approach point of each field.
Enabled on this figure are:
- box zoom (left click and drag around the area to zoom in)
- datatip (click on a field position to get their coordinates relative to the center of the substrate, row and column number)
- restore default view (house icon appearing when hovering the graph with the mouse)
Calibration curve
Top right axes show the current calibration curve to estimate a voxel size at different pressure values. This curve is used to determine any voxel size in all 3D previews made by the VCG.
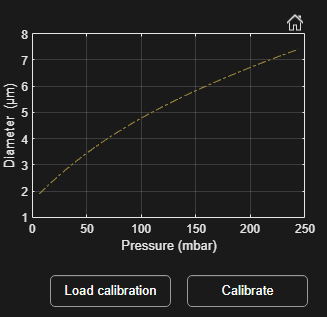
Load calibration allows the user to load a saved curve file in the VCG. Such files are describing a curve as a [P (mbar), D (µm)] list of points.
Calibrate opens the calibration app that allow a user to generate a calibration curve from the log files of a calibration pillar or a set of pillars. In this case, the VCG updates its calibration curve to the results plotted in the calibration app in real-time.
Clicking the house icon restores the default view (appearing when hovering the graph with the mouse).
This figure allows box zoom and displays datatips when hovering over points with the mouse cursor.
Process panel
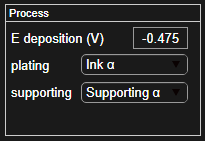
The deposition voltage used can be entered here. The value is stored for
future reference and does not control the potentiostat value applied. The same applies to the ink and supporting solutions.
Note that the user can edit the drop down lists freely in the InkList.txt and SupportList.txt in the working directory.
Notes
This button opens the Notes dialog or create a note file for this substrate. This can be used to write or read additional information about the substrate, print session or experiment that print or log files don’t save by default. Note files are saved in the substrate folder under /analysis.
Grid panel
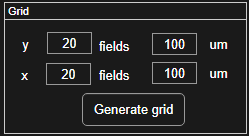
A new grid is generated by clicking the Generate grid button. The grid will
have the specified number of fields in x and in y, with the sizes of each field in µm.
Object position panel
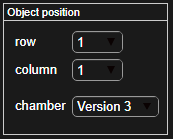
The structure to be printed will be added to the grid position,
determined by the selected row and column number amongst the fields defined in the grid panel.
The chamber refers to the printing chamber and it is crucial that the correct printing chamber is selected here. The printing chamber version determines the absolute position of the substrate grid origin in the XY coordinate system of CERES.
The entries available and the associated coordinates are defined in ChamberList.txt located in the main directory. Please do not change origin values for default chambers entries (Chamber Version 3).
Design skewing
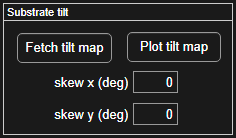
Issues may arise during and after printing a structure if the substrate is not perfectly in the horizontal plane, especially for large dimensions structures. Corrections can be applied by skewing the design prior to printing it instead of physically adjust the substrate tilt.
Skew x : the voxels of the design will be skewed in z along the x axis with
the angle specified here. Skewing is applied when clicking the Add button. Center of skewing is the approach point, the origin [0 0] of the collection figure.
Skew y: the voxels along the y axis will be skewed with the specified upon
clicking the Add button.
Note
Skewing induce an approximative correction if the tilt as vertical lines stay vertical (shears along Z are applied to the structure, not true rotations). This has the advantage to be a close approximation of a rotation for small skew angles and to not introduce any new XY movement that would slow down the printing. However, it can lead to printing issues of overhanging parts.
To know which skew angles to apply, a tilt measurement using the mapping workflow should be performed.
Fetch tilt mapmoves the output file from the mapping workflow in the substrate data analysis folder.Plot tilt map...opens a dialog to select a fetched file from the mapping workflow. Once selected, the probed surface map, along with data analysis and curves of the substrate X and Y angles are plotted. To compensate for the tilt, enter those angle values in the skew boxes. R^2 values displayed help to verify the reliability of the tilt measured.

Script tab
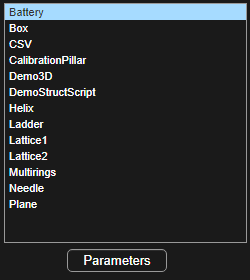
Scripts are used to generate voxels according to a parametrized design or shape. When a script is selected, the Parameters button can be clicked to access those parameters in the parameters editor window. A preview becomes available with the voxel diameter estimated from the calibration curve. Scripts are found in the bottom left tab. All the scripts available by default with the app are described here.
Object panel
The combine buttons
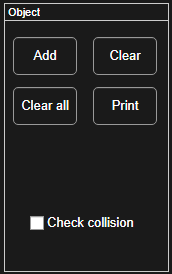
The Add button adds the structure that is defined by the selected script. Objects added to the current design can be viewed in the collection figure.
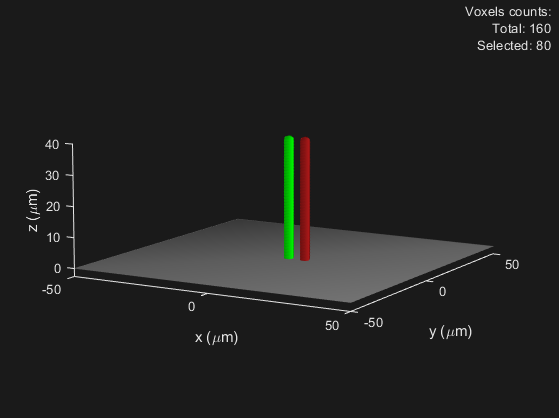
The Clear button removes the active object (current index object, plotted in green in the collection figure).
The Clear All button removes all structures from the current design.
The Print button prints the current design to a new printfile. Voxels turn brown in the collection figure. The substrate preview figure is updated with the printed structure in its position (row 1 column 1 in this example).
Collision with substrate
Check this box to enable a collision check upon clicking the Print button.
A routine will run that checks whether any collision of the probe incl. the
plastic holder will occur with structures already printed on the same substrate.
The routine will check against all merged print files present in the substrate folder. In case of collision, the printfile will not be created and a warning is displayed in the status bar. If structures being bent or smashed is of no importance (for example calibration pillars), uncheck this option and click Print again to ignore the warning and generate the printfile.
Collection, translation and rotation panels
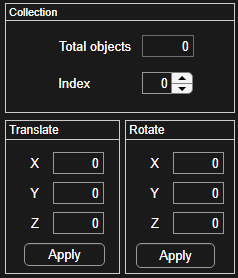
Total objects counts the number of objects in the current design. The Index allows to change the active object, plotted in green, used for the clear, translate and rotate actions.
Translate and rotate enable transformations on the active object by the amounts specified in the panels. The center of rotation is [0,0], origin of the design.
Note
Translation and rotation are also applied to any new object added to the design.
Routing panel
The routing is very important, as it specifies the sequence in which the voxels are printed. By default, voxels are printed as-generated, in the order they are added in the design. Objects are sorted by index number and voxels in an object are printed in the order generated by the script used.
This default routing could lead to collisions when multiple objects are added to a design or if a script generates voxels in a non optimal order. Multiple alternative options are available here to solve those issues:
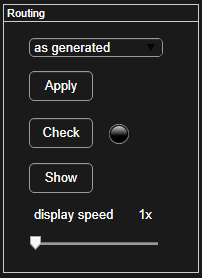
There are several routing options. Click Apply to reroute the voxels:
-
as-generated- Nothing is changed to the routing of the voxels, or the voxel routing is reverted to default. Objects are ordered according to their index number and voxels inside an object are ordered as specified by the scripts.
-
z- The voxels are sorted in +z only. The x and y sequence remain the same (for the same z coordinate).
-
x-y-z- The voxels are sorted in +z, then in +y and then in +x. So, the tip routing is first in +x, then in +y, then in +z.
-
y-x-z- The voxels are sorted in +z, then in +x and then in +y. So, the tip routing is first in +y, then in +x, then in +z.
-
auto correct- Tries to solve collisions by rerouting voxels with the minimal number of changes before checking the collision status again. More than one iteration of correction may be needed with this method to remove all collisions. The routing may fail if too many iterations are needed.
To additional features for the routing management can be used:
-
Check- Simulate the printing sequence to check the possibility of collision of the tip or consumable with the design itself. The lamp
 turns red
  if collisions are detected, or green
  if the design is estimated safe to print. Another routing option should be applied if collisions are detected.
-
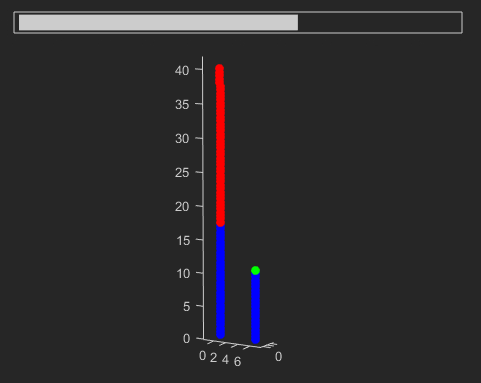
Show- In a new window containing a figure, the printing sequence is simulated. The green voxel represents the current position of the tip. If at any time during the simulation voxels turn red, a collision was detected and a routing correction is necessary. The
display speedslider can be used to vary the simulation speed. The speed value gives the number of voxels plotted at each frame (1-100). Closing the figure window stops the simulation.
Depending on the selected routing, the pressure sequence in the final print file can change as the printer goes from one voxel to the next. It should be considered that the response time of the tubing system can be up to a few seconds. For example, a pressure that changes every voxel may not be followed by the system and can lead to a constantly changing and undefined pressure at the tip.
Status bar
The status bar shows what the latest status of the VCG and its activities.
