Calibration App
The Calibration App determines the pressure - voxel diameter relation based on printed calibration pillars.
Graphic interface
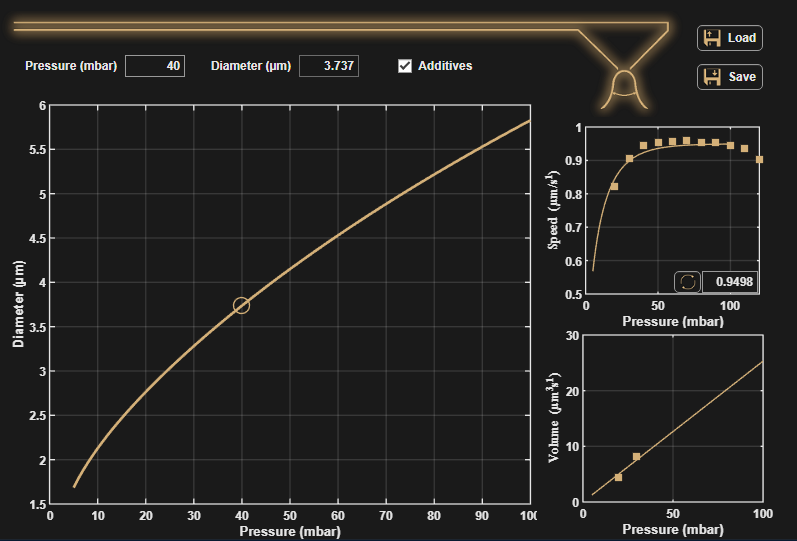
The main figure shows the calibration curve giving a good approximation of the pressure-voxel diameter relation in the case of a pillar structure. Note that the diameter also depends on the surrounding area (when printing 2D or 3D structures or printing close to a non conductive area for example).
Entering a pressure value (in mbar) in the corresponding dialog box updates the corresponding diameter box according to the calibration curve.
Presence of additives in β recipes will slightly change the diameter-pressure relation compared to α recipes (without additives). The additives checkbox can take into account the presence or the lack of additives in the chemistry used.
The user can load one or multiple .mat report file(s) from any substrate folder with the load button. To generate such input files, use the LogViewer app. Make sure all loaded files are reported as 100% finished and use only pillars or calibration pillars. The calibration procedure may otherwise give wrong results.
The user can save the calibration curves obtained with the save button. They are stored in the substrate folder of the input files, under a calibration subfolder.
The two small figures on the right show the plating speed and the volumetric deposition rate as functions of the pressure. The dialog box and the  button can be used to finely tune the saturation plating speed (plateau at high pressures) or to better fit the calibration data.
Calibration Procedure
When varying the pressure, the plating speed - pressure relation always display a typical shape :
- Starting at 0 mbar applied (no flow), the plating speed (growth rate of a voxel in µm/s) quickly increases with the pressure, then saturates above a given pressure called the saturation pressure.
- The volumetric deposition speed (the volume of copper deposited per second) has a linear relationship with pressure.
Therefore, the calibration of a tip requires the measurement of voxel times at different pressures applied to flow the ink. Pillars need to be printed to gather enough data points in the regime around the saturation pressure to reconstruct the pressure-diameter relation. The calibration pillar script can perform a pressure ramp and reduce the calibration procedure time with little to no accuracy lost. The box script can be used to print multiple individual pillars at different pressures and load them together in the calibration app.
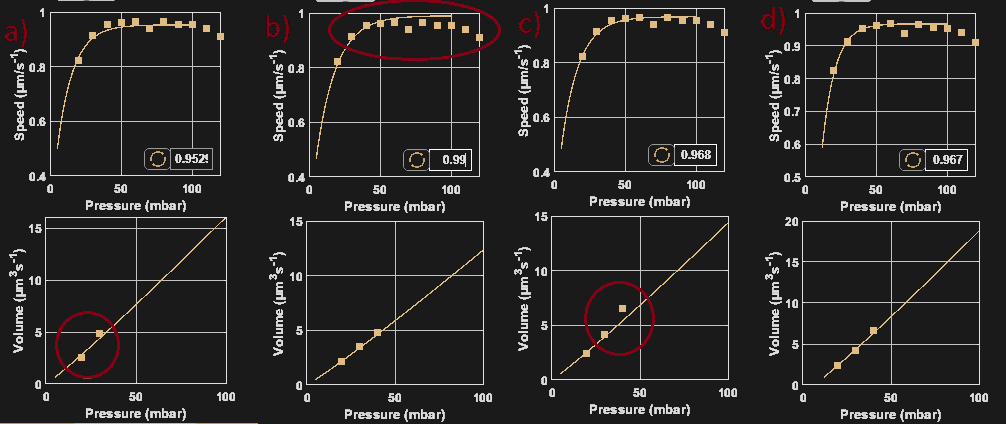
Once the calibration app is loaded with file(s), it will attempt an automatic fit. For example in figure a) below, the plating speed-pressure curve is not exactly fitting the experimental data points, and only 2 points are available for the volume-pressure curve fitting. In that case, the user should adjust the saturation plating speed in the dialog box to best fit both curves. Figure b) was adjusted with a too high saturation plating speed despite the volume-pressure curve fitting being good. Figure c) has a good speed-pressure fit but a poor volume-pressure curve fit. Figure d) shows a well-adjusted calibration, fitting both speed and volume - pressure curves.
Remember to check or uncheck the additive box if needed, depending on the chemistry used.
The tip is now calibrated and the user can save the calibration file. The VCG automatically updates its calibration curve with the calibration app. One can also save the calibration file and load it in the VCG.
Note
If not enough points are available on the volume-pressure curve fitting, consider adding measure points at lower pressures: extend the pressure list to lower pressures in the calibration pillar parameters or print pillars at lower pressures.
Calibration File
Calibration files generated with the Calibration App are saved in a Calibration folder, located in the substrate folder of the .mat file(s) used for the calibration fitting. Information about the presence of additives (checkbox) are saved in the filename of the calibration file.
The file structure is as follows, with each line being a sampling point in the pressure range calibrated:
<Pressure (mbar)>,<Diameter (µm)>,<Plating speed (µm/s)>,<Volumetric deposition rate (µm<sup>3</sup>/s)>
Example:
12,1.062,0.617,1.479
13,1.245,0.655,1.555
14,1.428,0.689,1.624
15,1.611,0.718,1.690
16,1.795,0.744,1.752
17,1.978,0.767,1.811
18,2.161,0.788,1.868
19,2.344,0.806,1.923
20,2.527,0.823,1.977
21,2.711,0.837,2.029
22,2.894,0.850,2.081
23,3.077,0.862,2.131
24,3.260,0.873,2.180
25,3.444,0.882,2.228
26,3.627,0.891,2.276
27,3.810,0.898,2.323
28,3.993,0.905,2.369
...